GKE Implementation Steps
Posted on July 28, 2024
1. Before you start a. In this tutorial, I use the GCP console to create the Kubernetes cluster and Code Shell for connecting and interacting with it. You can, of course, do the same from your CLI, but this requires you have the following set up: b. Installed and configured gcloud c. Installed kubectl: (gcloud components install kubectl)
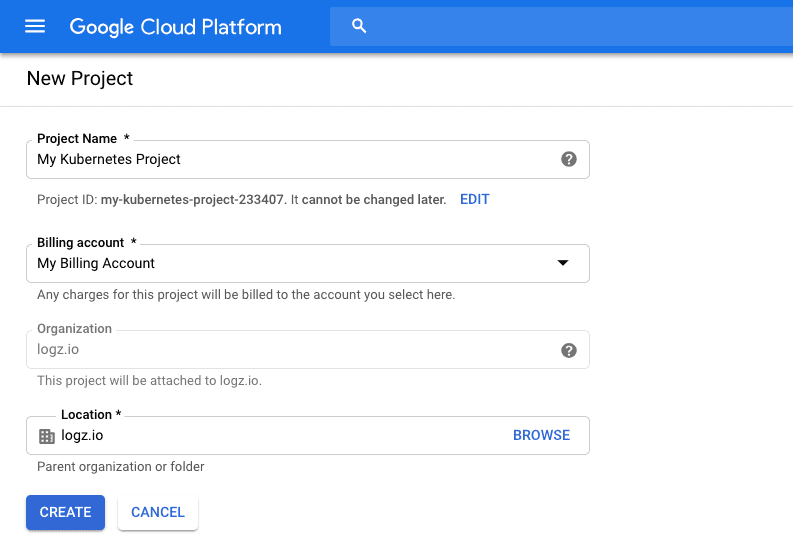
2. Create a new project Creating a new project for your Kubernetes cluster — this will enable you to sandbox your resources more easily and safely. In the console, simply click the project name in the menu bar at the top of the page, click New Project, and enter the details of the new project:
3. We can now start the process for deploying our Kubernetes cluster. Open the Kubernetes Engine page in the console, and click the Create cluster button (the first time you access this page, the Kubernetes API will be enabled. This might take a minute or two):
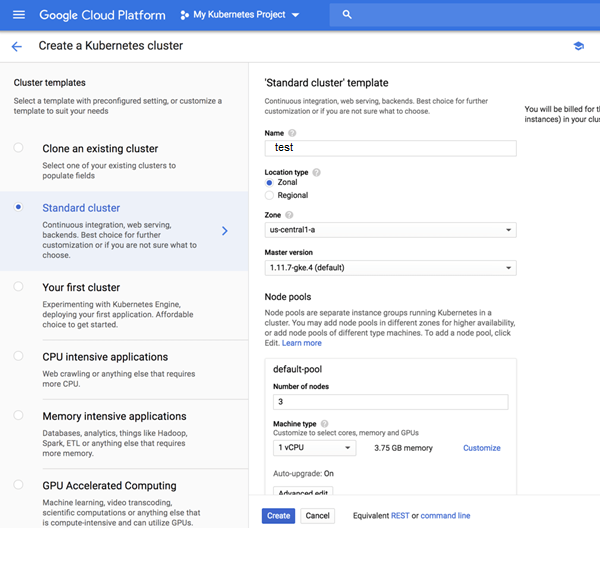
GKE offers a number of cluster templates you can use, but for this tutorial, we will make do with the template selected by default — a Standard cluster. There a are a bunch of settings we need to configure: Name – a name for the cluster. Location type – you can decide whether to deploy the cluster to a GCP zone or region. Read up on the difference between regional and zonal resources here. Node pools (optional) – node pools are a subset of node instances within a cluster that all have the same configuration. You have the option to edit the number of nodes in the default pool or add a new node pool. There are other advanced networking and security settings that can be configured here but you can use the default settings for now and click the Create button to deploy the cluster. After a minute or two, your Kubernetes cluster is deployed and available for use
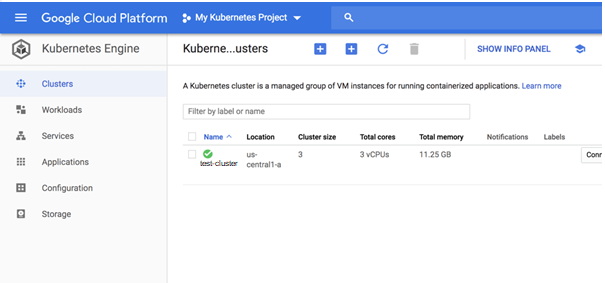
4. Use kubectl to Connect to the Cluster Clicking the name of the cluster, we can see a lot of information about the deployment, including the Kubernetes version deployed, its endpoint, the size of the cluster and more. Conveniently, we can edit the deployment’s state. Conveniently, GKE provides you with various management dashboards that we can use to manage the different resources of our cluster, replacing the now deprecated Kubernetes dashboard: Clusters – displays cluster name, its size, total cores, total memory, node version, outstanding notifications, and more. Workloads – displays the different workloads deployed on the clusters, e.g. Deployments, StatefulSets, DaemonSets and Pods. Services – displays a project’s Service and Ingress resources Applications – displays your project’s Secret and ConfigMap resources. Configuration Storage – displays PersistentVolumeClaim and StorageClass resources associated with your clusters. You will need to configure kubectl in order to connect to the cluster and thus to communicate with it. You can do this via your CLI or using GCP’s Cloud Shell. For the latter, simply click the Connect button on the right, and then the Run in Cloud Shell button. The command to connect to the cluster is already entered in Cloud Shell:
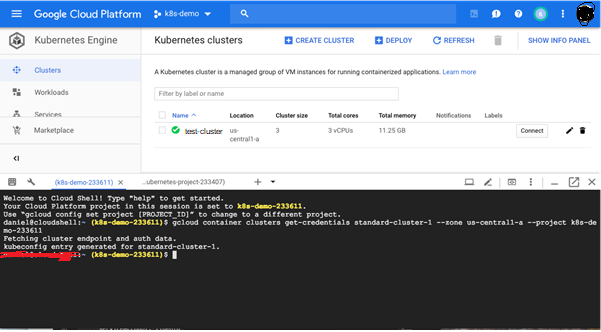
Hit Enter to connect. You should see this output: Fetching cluster endpoint and auth data. kubeconfig entry generated for daniel-cluster. Copy To test the connection, use: kubectl get nodes NAME STATUS ROLES AGE VERSION gke-standard-cluster-1-default-pool-227dd1e4-4vrk Ready 15m v1.11.7-gke.4 gke-standard-cluster-1-default-pool-227dd1e4-k2k2 Ready 15m v1.11.7-gke.4 gke-standard-cluster-1-default-pool-227dd1e4-k79k Ready 15m v1.11.7-gke.4 5. Deploying a sample app (skip step 5 it is just a sample app) Our last step is to deploy a sample guestbook application on our Kubernetes cluster. To do this, first clone the Kubernetes examples repository. Again, you can do this locally in your CLI or using GCP’s Cloud Shell: git clone https://github.com/kubernetes/examples Copy Access the guestbook project: $ cd examples/guestbook $ ls all-in-one legacy README.md redis-slavefrontend-deployment.yaml MAINTENANCE.md redis-master-deployment.yaml redis-slave-deployment.yaml frontend-service.yaml php-redis redis-master-service.yaml redis-slave-service.yaml The directory contains all the configuration files required to deploy the app — the Redis backend and the PHP frontend. We’ll start by deploying our Redis master: $ kubectl create -f redis-master-deployment.yaml $ kubectl get svc NAME TYPE CLUSTER-IP EXTERNAL-IP PORT (S) AGE kubernetes ClusterIP 10.47.240.1 443/TCP 1h redis-master ClusterIP 10.47.245.252 6379/TCP 43h To add high availability into the mix, we’re going to add two Redis worker replicas: $ kubectl create -f redis-slave-deployment.yaml Our application needs to communicate to the Redis workers to be able to read data, so to make the Redis workers discoverable we need to set up a Service: kubectl create -f redis-slave-service.yaml Copy We’re not ready to deploy the guestbook’s frontend, written in PHP. kubectl create -f frontend-deployment.yaml Copy Before we create the service, we’re going to define type:LoadBalancer in the service configuration file: $ sed -i -e ‘s/NodePort/LoadBalancer/g’ frontend-service.yaml Copy To create the service, use: $ kubectl create -f frontend-service.yaml Copy Reviewing our services, we can see an external IP for our frontend service: $ kubectl get svc (below is just a test ) NAME TYPE CLUSTER-IP EXTERNAL-IP PORT (S) AGE Frontend LoadBalancer 10.47.255.112 35.193.66.204 80:30889/TCP 57s kubernetes ClusterIP 10.47.240.1 443/TCP 1h redis-master ClusterIP 10.47.245.252 6379/TCP 43s redis-slave ClusterIP 10.47.253.50 6379/TCP 6m

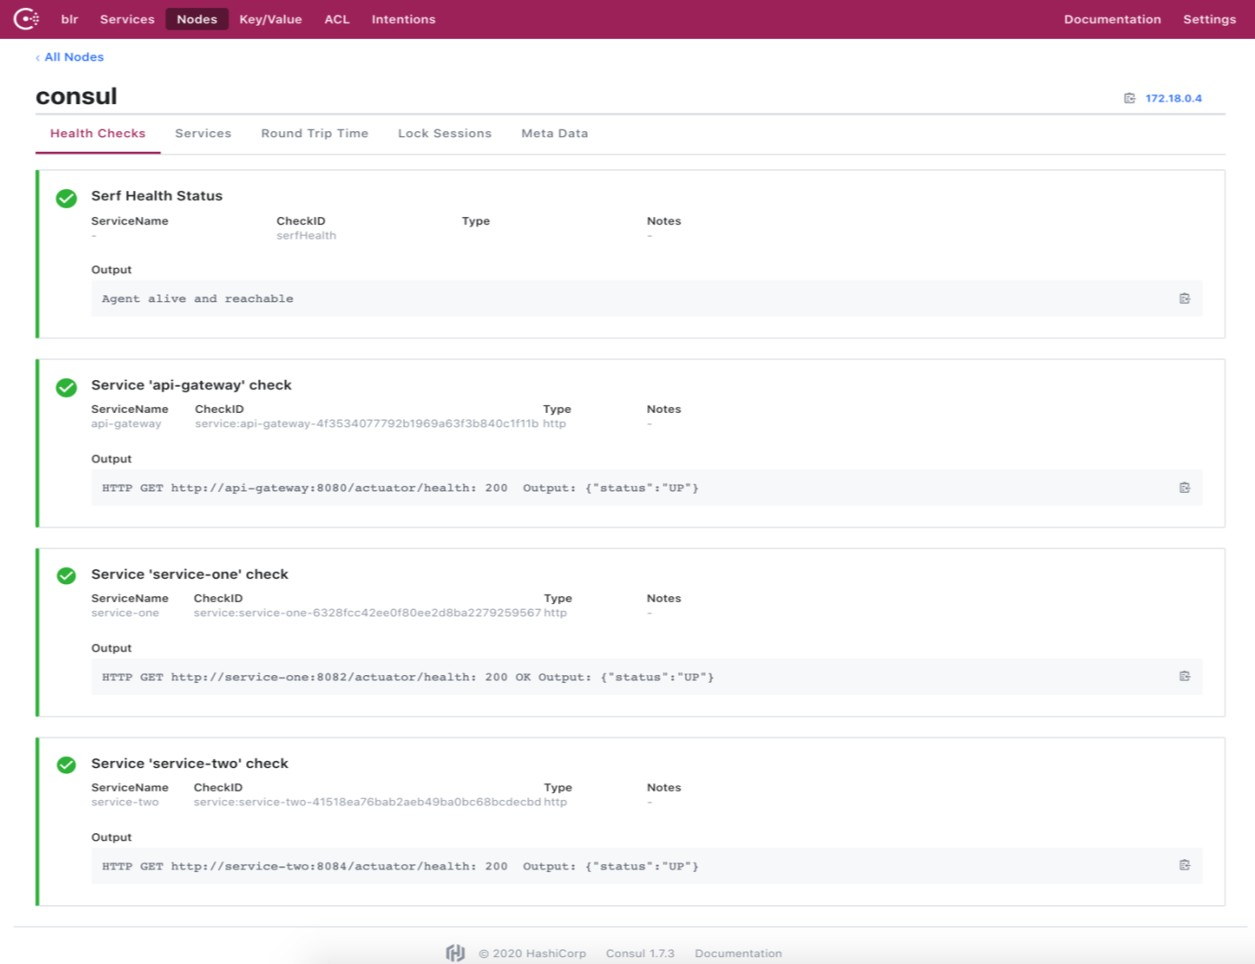
6. Deploy our sample application $ git clone https://github.com/vmudigal/microservices-sample.git $ cd microservices-sample $ mkdir yamls $ cd yamls $ kubectl apply -f xyz.yaml (here apply one by one all the yamls ) $ kubectl get svc Note (All the above below ports in diagram must be open in your VPC and replace gkelink with your EIP link when generated at the time of creating cluster ) And then verify Tools: Consul Management console: http://gkelink:8500/ui/
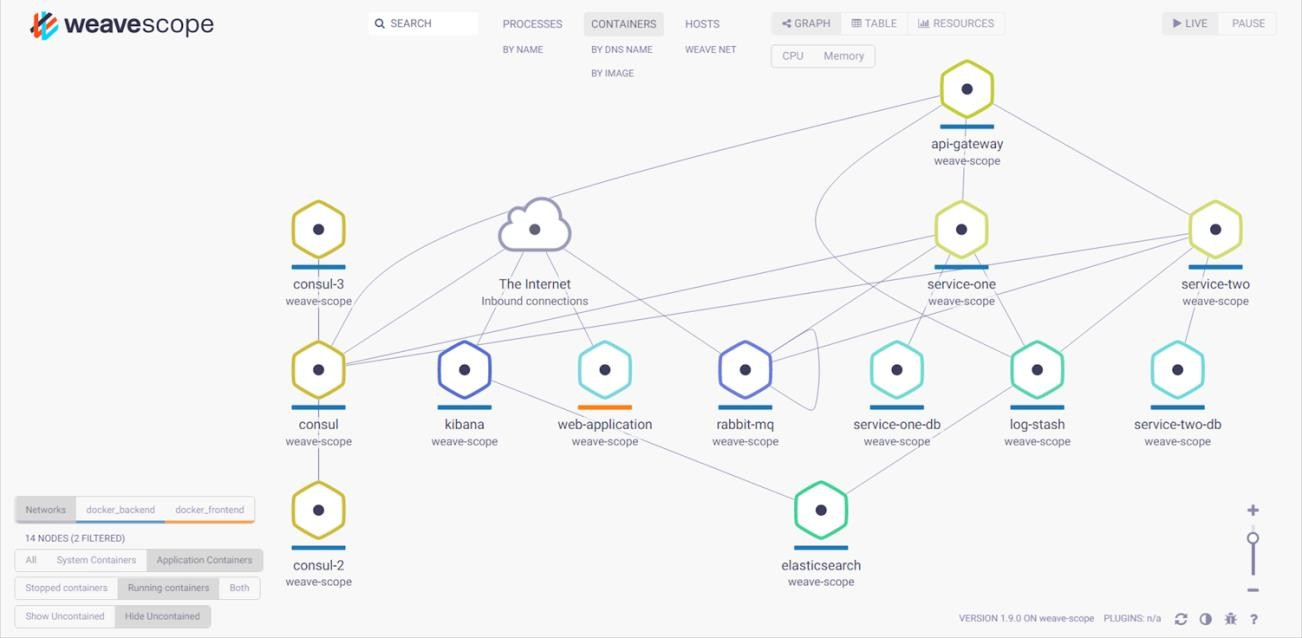
MONITORING AND VIZUALIZATION Monitoring, visualisation & management of the container in docker is done by weave scope. Tools: Weavescope Management Console: http://gkelink:4040/
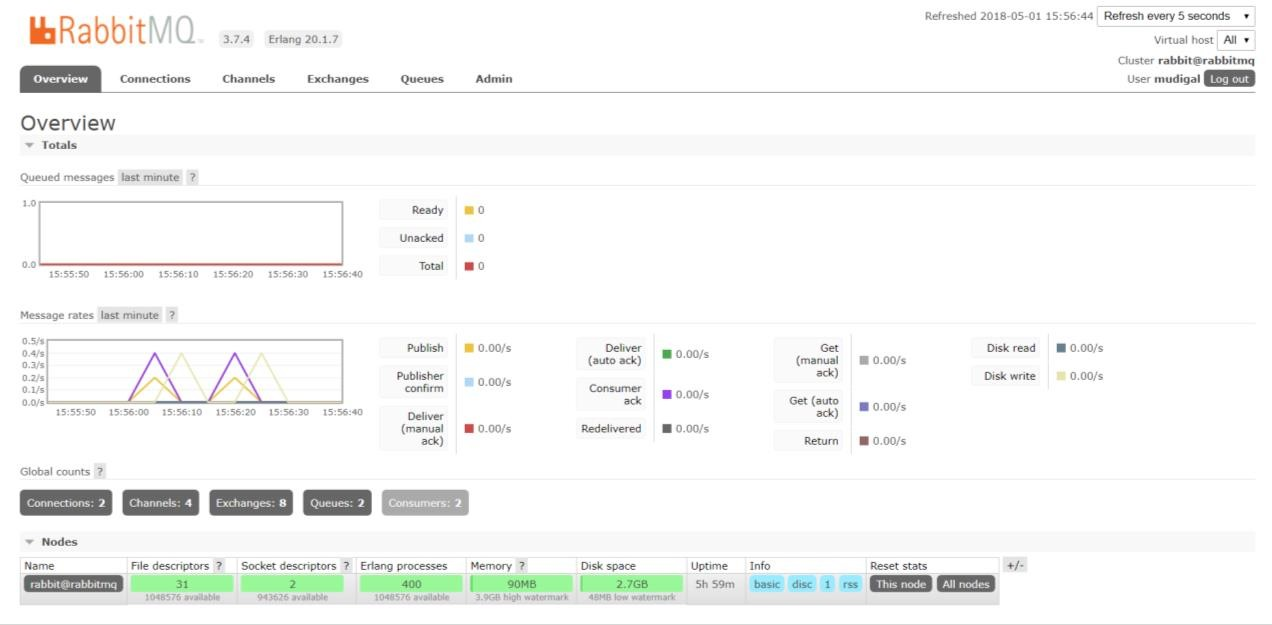
CENTRALIZED LOGGING USING ELK Our services use Logback to create application logs and send the log data to the logging server (Logstash). Logstash formats the data and send it to the indexing server (Elasticsearch). The data stored in elasticsearch server can be beautifully visualized using Kibana. Tools: Elasticsearch: http://gkelink:9200/_search?pretty Kibana: http://gkelink:5601/app/kibana MICROSERVICES COMMUNICATION Intercommunication between microservices happens asynchronously with the help of RabbitMQ. Tools: RabbitMQ Management Console: http://gkelink:15672/
